Problem
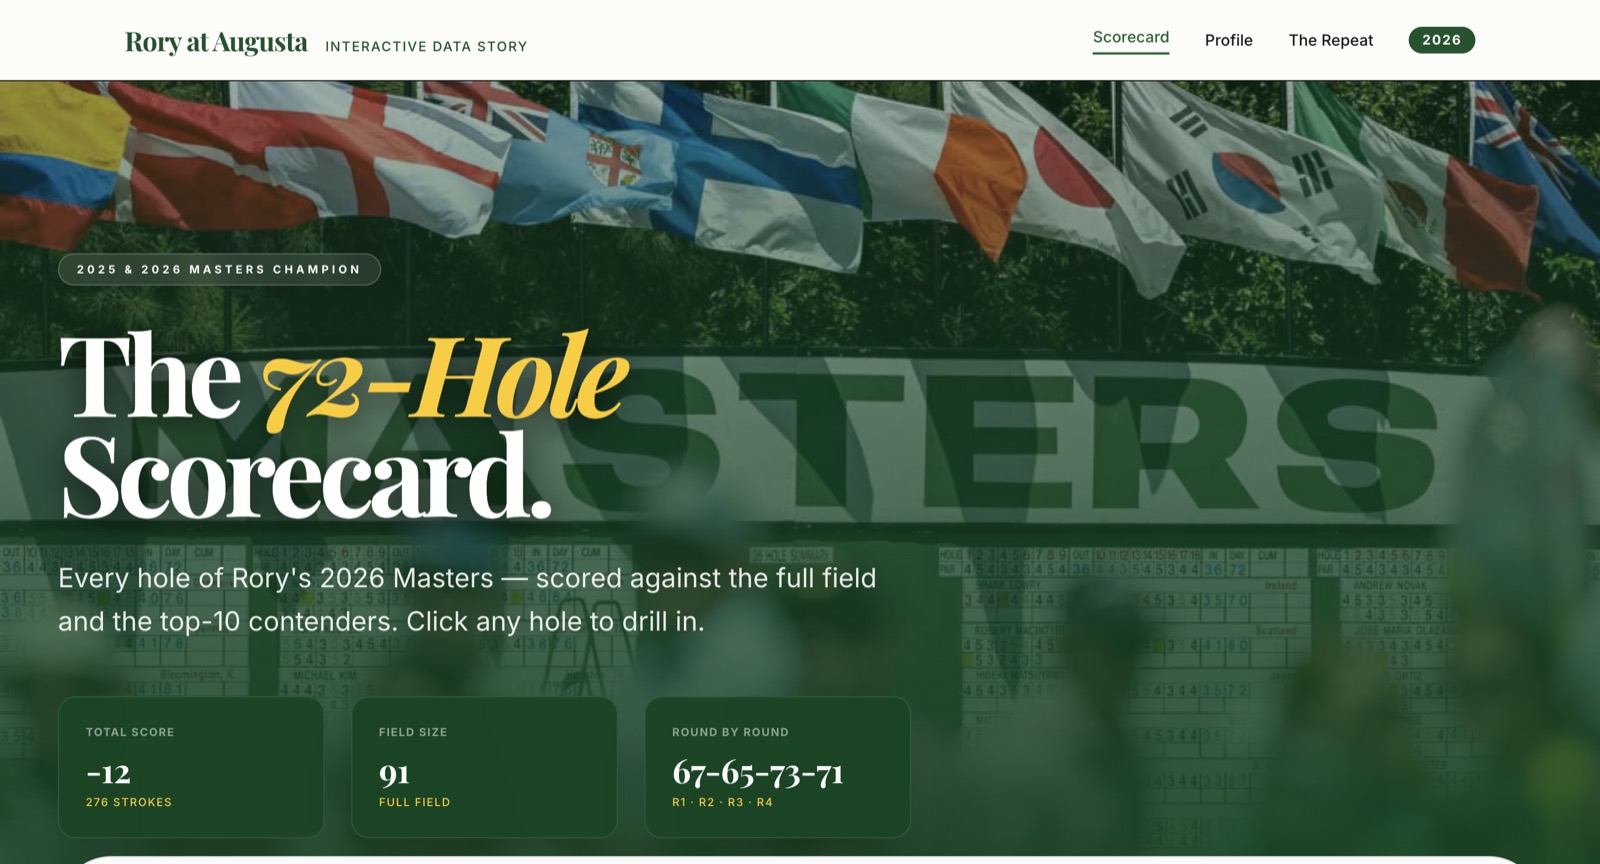
Tournament coverage often collapses into a leaderboard. This project builds a navigable analytical surface around player paths, hole-by-hole scoring, field/top-10 comparisons, and repeat-champion context.
/ Golf Data Storytelling & Static Analytics
A static React/TypeScript analytics story that turns tournament JSON artifacts into interactive scorecards, player comparisons, repeat-champion context, and Recharts-based visualizations.
Tournament coverage often collapses into a leaderboard. This project builds a navigable analytical surface around player paths, hole-by-hole scoring, field/top-10 comparisons, and repeat-champion context.
Vite/React app with TypeScript selectors, static JSON artifact imports, Node/Playwright data pipeline, scorecard/course validation, deterministic generated data, and chart-ready transforms.
Vite, React, TypeScript, Recharts, Node, Playwright, JSON artifacts, Vercel.